
Maricopa County Home Sales, October 2026
In September, half the homes that sold in Maricopa County did so only after a price cut. According to the September 2026 report from Phoenix REALTORS®, the county had 15,422 single-family homes for sale, or 3.9 months of supply, up from 3.7 a year ago. Months of supply is how long it would take to sell every home on the market at the current pace if no new listings came on. Four to six months is generally considered balanced, so the county is right at the edge. Buyers have more choices and more room to negotiate than they’ve had in a while, and sellers who price right are still finding buyers every day.
Nearly half the homes for sale right now have been on the market for more than two months. Forty-eight percent of active listings have been up 60 days or longer, a third 90 days or more, and 54% have already cut their price, by a median of about 4%. Buyers should read listing histories, because a home that’s been sitting with a cut or two usually has a seller ready to talk. Sellers past 60 days have already heard from the market, and in my experience, one meaningful cut to recent-sales levels brings buyers back faster than a string of small ones.
September’s sales show where that leads. Of the 4,385 homes that closed in Maricopa County in September, about half never required a price reduction. Those homes sold in a median of 29 days, for essentially their full asking price. The other half cut their price, sat for a median of 95 days, and sold for about 7% less than they were first listed for. Starting too high cost those sellers two extra months on the market.
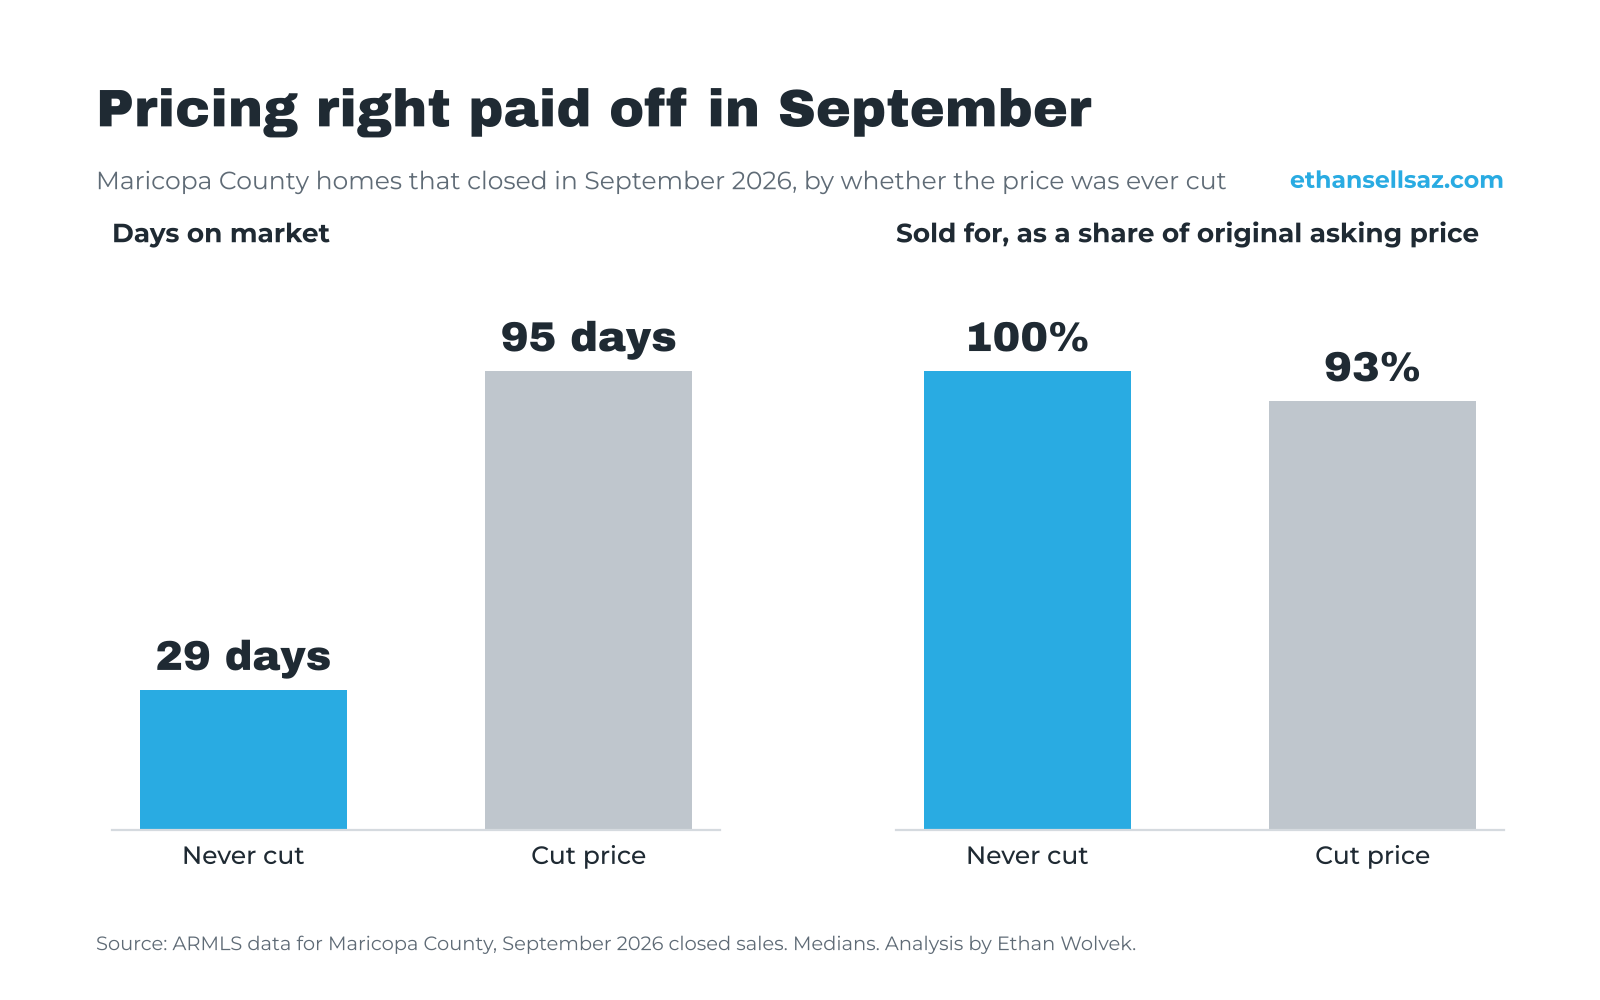
Buyers should expect a well-priced home to move in about a month, so the right house at the right price still calls for a decision, even in a slower market. Sellers should take the opposite lesson and price to the market from day one. Pricing is the hardest conversation in this business, and plenty of sellers aren’t getting a straight answer about it at the listing appointment. I’d rather have that conversation on day one than on day 95.
Compared with a year ago, the market has held steady more than it's slipped. September closings were down about 5% from last year, 4,385 compared with 4,633. The median price per square foot was essentially flat at $262. Homes sold a few days faster, in a median of 56 days compared with 60 in September 2025, and a slightly smaller share needed a price cut to sell. For buyers waiting on a big drop in values, the data doesn't show one coming. For sellers, the equity they've built has held, and what's changed is how much negotiating it takes to get a deal done.
Where you shop matters as much as when. Single-family homes are right at the line between a seller’s market and a balanced one, yet more than half of single-family listings have already cut their price. According to ARMLS data, condos and townhomes are at 6.3 months of supply, with 40% of active listings sitting for 90 days or more, and homes priced at $1 million and up are at 5.7 months. New construction is moving faster than resale right now. For every 100 new homes listed, 32 are under contract, compared with 24 out of every 100 resale listings, which tells me buyers are finding value in what builders are offering.
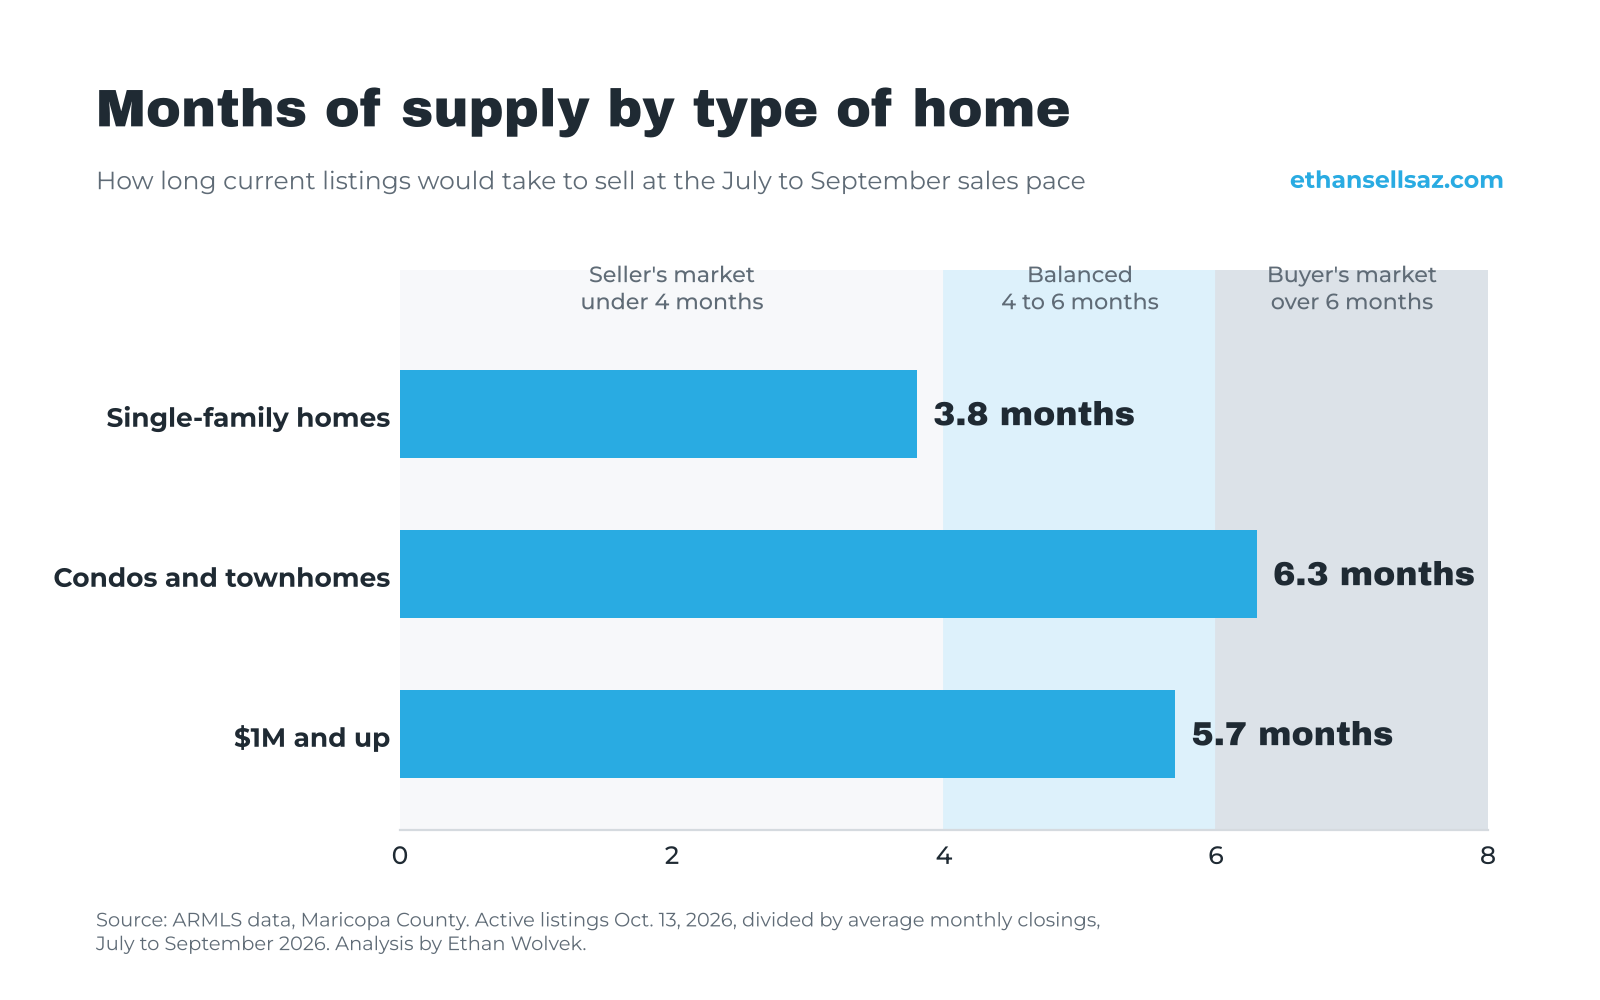
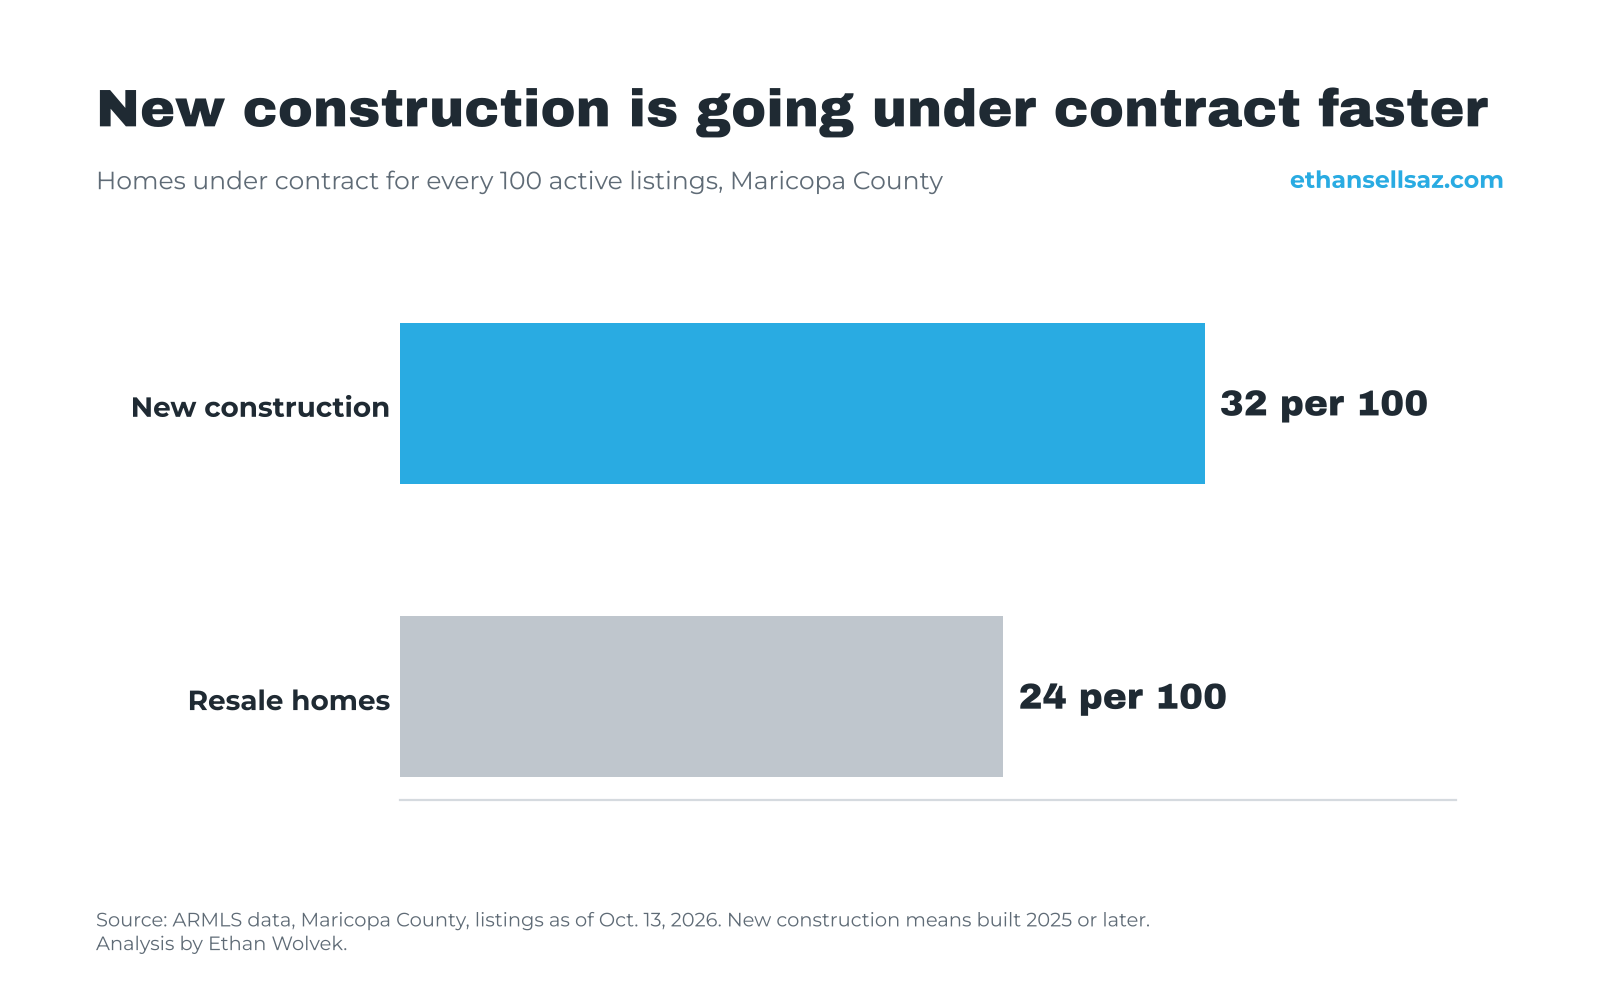
Buyers will find the most room to negotiate on condos and higher-end homes, and new builds belong on any shopping list. Single-family sellers are in the best position, as long as they price to recent sales, while condo and luxury sellers need the sharpest pricing to stand out.
If you're buying, you have time to be thorough and room to negotiate. Look closely at listing histories, ask about closing costs and repairs on homes that have been sitting, and compare resale against new construction in the same area before you commit. Be ready to move quickly when a newly listed home is priced in line with recent sales, because those homes are still selling in about a month.
If you're selling, price your home against what's sold in the last 90 days. Spring list prices won't tell you much now. Homes priced right from the start sold in about a month in September and kept more of their asking price. Get the home ready before it hits the market, and if the showings and offers aren't coming in the first few weeks, adjust once and meaningfully. If you're weighing a move and want to see what these numbers look like for your neighborhood or price range, I'm happy to pull them for you.
Inventory and months of supply in the opening paragraph are from the September 2026 report by Phoenix REALTORS®. All other figures are from ARMLS data for Maricopa County and cover single-family homes, townhomes, condos, patio homes and twin homes, excluding manufactured homes. Closed sales compare September 2026 with September 2025. ARMLS inventory is as of October 13, 2026, and ARMLS months of supply is based on average monthly closings from July through September 2026.
This post was drafted with AI assistance. It has been reviewed, fact checked, and edited by me before publishing. All analysis and anything with a point of view is mine, and any opinions expressed are not those of eXp Realty or the Legacy Real Estate Team.